
sobota 3. září 2016
pátek 2. září 2016
howto get router syslog huawei/cisco/juniper via fluentd to elasticsearch & kibana
objective:
- visualisation of syslog in kibana, host wise... Here is final example:

what i have:
-let say i have kibana 4.4.x, fluentd ,elasticsearch plugin installed
if you try to do visualisation with default setup, you can notice host & message field get splited(exact algorythm depends on elasticsearch)
problem with kibaba&elasticsearch is, by default all fields inserted with elasticsearch plugin, are defined as strings ==automatically analysed. This is making any visualisation impossible...
solution is to have data inserted to fluentd mapped not to strings, but to multitype ( string & raw)...
in order to do it , it is necesary to create special template in elasticsearch, before you start sending data by fluentd ! you cant change mapping later. so first make template.
1. install to your chrome browser extension sense, so you can work with elasticsearch
2. with sense, insert to your elastic database template:
(https://www.elastic.co/guide/en/elasticsearch/reference/current/indices-templates.html)
put /_template/template_syslogxx
{
"template": "syslogxx-*",
"settings": {
"number_of_shards": 1
},
"mappings": {
"fluentd": {
"properties": {
"@timestamp": {
"type": "date",
"format": "strict_date_optional_time||epoch_millis"
},
"host": {
"type": "multi_field",
"fields": {
"host": { "type": "string" },
"raw": { "type": "string", "index": "not_analyzed" }
}
}
,
"ident": {
"type": "string"
},
"message": {
"type": "multi_field",
"fields": {
"message": { "type": "string" },
"raw": { "type": "string", "index": "not_analyzed" }
}
}
,
"pid": {
"type": "string"
},
"tag": {
"type": "string"
}
}
}
}
}
3. configuration of fluentd...
-change host / port
-smal note - i found quite annoying , following 2 commands are order sensitive:
logstash_prefix netsys, logstash_format true
-multiformat & format part is handling huawei specific message pattern. tested on ne40 / s9xx
<source></source>
type syslog
port 514
bind 0.0.0.0
tag vystupnormal
format multi_format
<pattern>
format /^(?<time>[^ ]*\s*[^ ]* [^ ]* [^ ]*) (?<host>[^ ]*) ?(?:[^\:]*\:)? *(?<message>.*)$/
time_format %b %d %Y %H:%M:%S+03:00
</message></host></time></pattern>
<pattern>
format syslog
</pattern>
<pattern>
format /(?<time>\d{4}-\d{1,2}-\d{1,2} \d{1,2}:\d{1,2}:\d{1,2},\d{3}) (?<message>(.|\s)*)/
</message></time></pattern>
<match vystupnormal.="">
type copy
<store>
type stdout
</store>
<store>
type elasticsearch
host 192.168.1.1
port 9200
include_tag_key true
logstash_prefix syslogxx
logstash_format true
type_name fluentd
</store>
</match>
4. by now, you should be able to add to kibana syslogxx-* :
settings--> indices --> put syslogxx-* to empty row, etc.
sobota 27. srpna 2016
script for filtering interfaces on huawei router
simple example howto get filtered list of interfaces from router. script is using jumpserver to reach router, and
connection from jumpserver to router is using telnet
command:
python inter.py -e AAAAAAAAA -f ".*test.*"
command:
python inter.py -e AAAAAAAAA -f ".*test.*"
pátek 29. července 2016
virl & securecrt
busy busy busy
not so easy as one would expect .
not so easy as one would expect .
(long live ki.. securecrt :) )
- open VM Maestro
- put 2 routers and connect them
- click on background in design mode
- properties -> topology -> management network ->select shared flat network
- properties ->netkit-> ip address family -> select v4
- properties ->netkit-> ip infracture address -> put 172.16.0.0
- properties ->netkit-> prefix -> put 24
- click on 1. router
- properties -> extensions -> click +
- key - put static_ip
- value - put(it is possible you need to resize window to be able to put value) 172.16.1.11
- click ok
- repeate 8.-12. on second router ( jsut in step 11. use 172.16.1.12)
- click on build initial, and click ok on both windows
- click on run simulation
- once both routers are runing, you need to get path for securecrt exe. in my case it is C:\Users\tra20\app\securecrt8.x\SecureCRT.exe
- put linked script somewhere to disk. in my case path is C:\Users\tra20\etc\virl\ScriptHost.vbs
- click on file -> preferences in vm maestro, then terminal->cisco terminal
- select use external termina applications
- fill:
- ssh command : C:\Users\tra20\app\securecrt8.x\SecureCRT.exe
- ssh arguments : /SCRIPT "C:\Users\tra20\etc\virl\ScriptHost.vbs" /N %t /T /SSH2 /P %p %h /L guest /PASSWORD guest /ARG %r
- to open ssh just click in view "simulations" on router, and ssh...
středa 13. dubna 2016
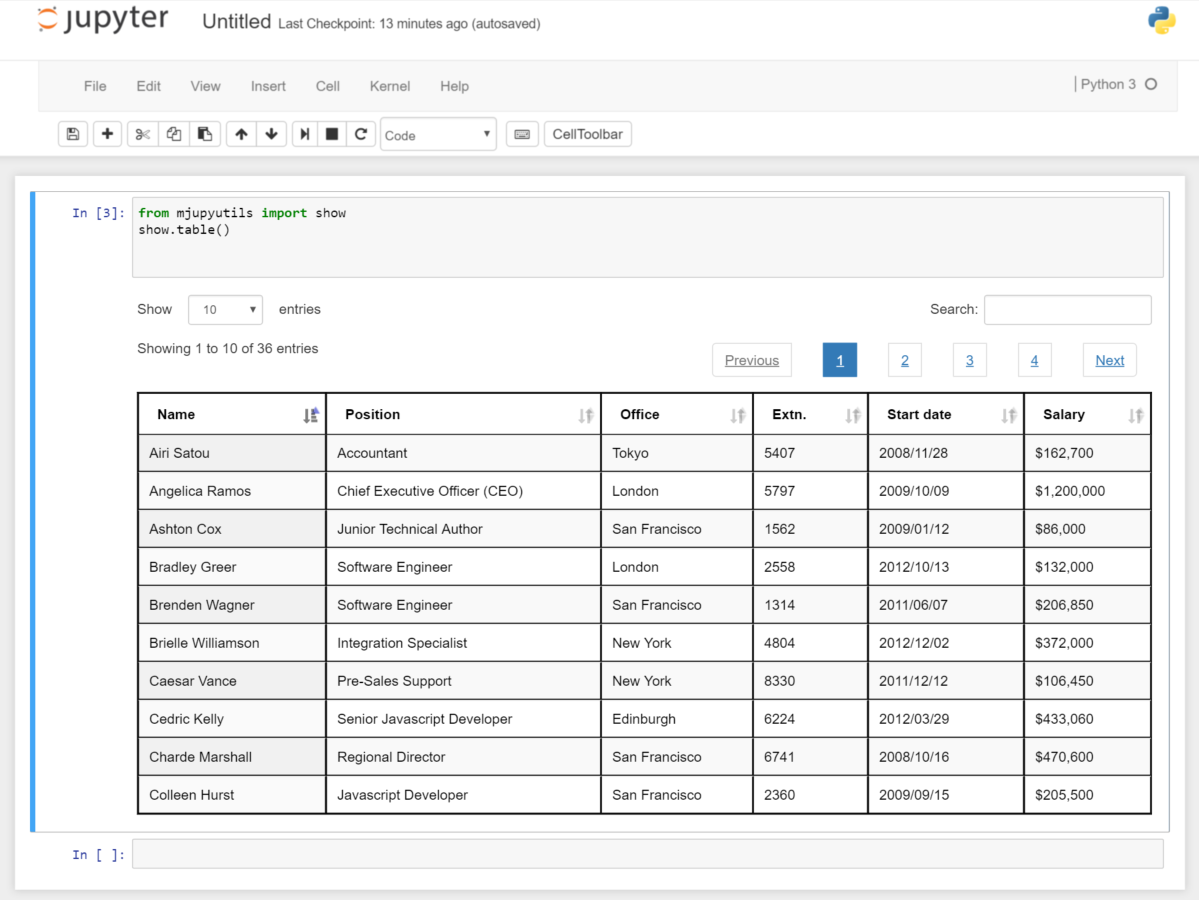
so here we go... mjupyutils....
installation:
pip -v install git+https://github.com/mraky/mjupyutils.git
example of usage:

installation:
pip -v install git+https://github.com/mraky/mjupyutils.git
example of usage:
pondělí 11. dubna 2016

Přihlásit se k odběru:
Komentáře (Atom)